Customer
Experience
Metrics
Customer Experience Metrics
NPS
Net Promoter Score
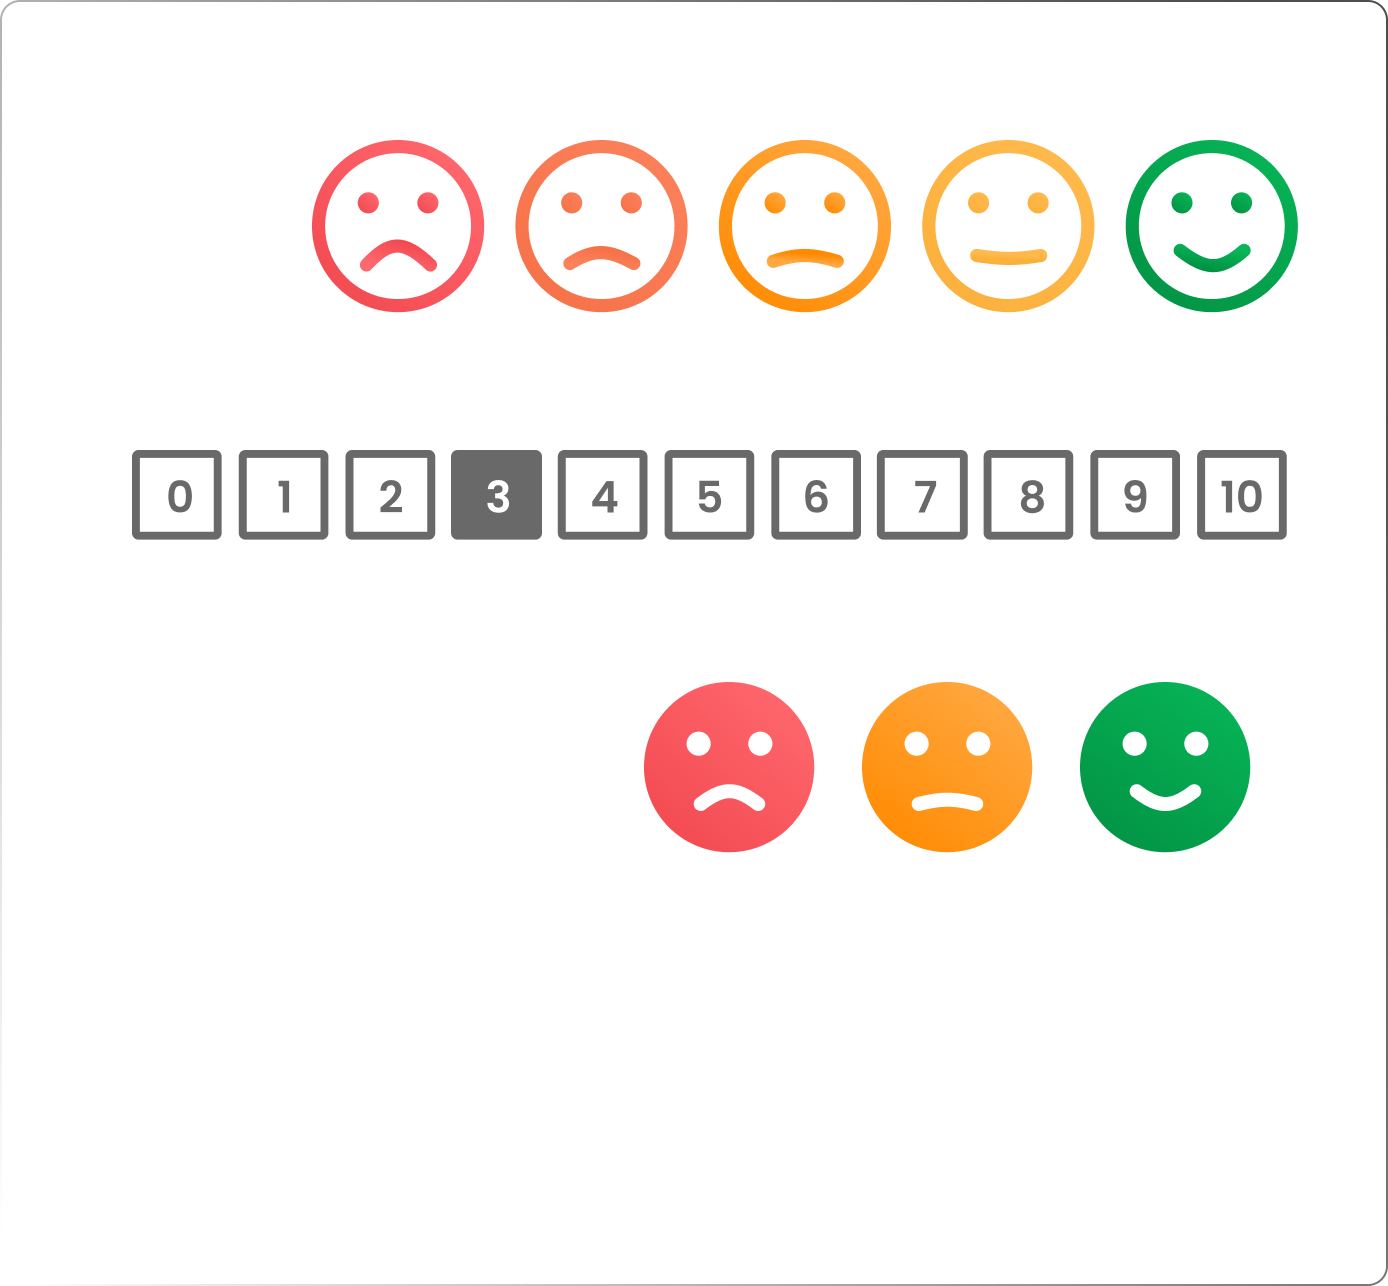
Net Promoter Score (NPS) is a simple, effective way to measure customer satisfaction and how willing customers are to recommend a company, product, or service.
At its core is one key question:
“On a scale from 0 to 10, how likely are you to recommend our company, product, or service to a friend or colleague?”
The answer gives companies a clearer view of how customers perceive their experience, where they are delivering value, and where there is room to improve.

Customer Segmentation
In the NPS methodology, customers are divided into three groups:
Calculation
The final NPS is calculated as the percentage of promoters minus the percentage of detractors. As a result, the Net Promoter Score can range from -100 to +100.

Do you need more information about NPS?
CSAT
Customer Satisfaction Score (CSAT)
Customer Satisfaction Score (CSAT) is a metric used to measure how satisfied customers are with a product, service, or their overall experience with a company. It’s typically collected through a short survey or rating scale where customers can quickly express their level of satisfaction.
CSAT is often measured with a simple question such as:
“How satisfied are you with our service / product / overall experience?”
Responses are usually given on a scale from 1–3 or 1–5, where higher scores indicate a higher level of customer satisfaction.

Customer Segmentation
In the CSAT methodology, customers are typically divided into three groups:
Calculation
CSAT is calculated as the ratio of positive responses to the total number of responses, multiplied by 100. The final score ranges from 0 (very dissatisfied customers) to 100 (very satisfied customers).

Do you need more information about CSAT?
CES
Customer Effort Score (CES)
Customer Effort Score (CES) is a metric used to measure how much effort customers must invest when interacting with a company, product, or service. CES focuses on evaluating the ease, convenience, and efficiency of the processes customers go through.
CES is typically collected through a simple question such as:
“How much effort did you personally have to put in to resolve your issue or complete your request?”
Responses are usually given on a 1–5 or 1–7 scale, where a lower score indicates higher effort and a higher score indicates lower effort.

Customer Segmentation
In the CES methodology, customers are typically divided into three groups:
Calculation
The final CES is calculated as the arithmetic average of all responses. The score typically ranges from 1 (very difficult or complicated experience) to 7 (a very easy and efficient experience).

Do you need more information about CES?
OES
Overall Experience Score (OES)
Overall Experience Score (OES) is an innovative methodology for measuring and managing both customer and employee experience, developed by InsightSofa. The method uses artificial intelligence to analyze the entire survey — including all questions and responses — and assigns an overall score on a 0–10 scale.
Unlike traditional methodologies such as NPS, CES, or CSAT, which focus on a single question, OES evaluates the full context of the survey. This provides companies with deeper insights and more accurate data for experience management and decision-making.
InsightSofa’s AI analyzes every question and response collected in the survey. Based on this analysis, it assigns several scores on a 0–10 scale across four key dimensions:
- Customer and employee satisfaction
- Likelihood to recommend
- Ease of interaction with the company
- Relationship with the company (loyalty)

The final CES is calculated as the arithmetic average of all responses. The score typically ranges from 1 (very difficult or complicated experience) to 7 (a very easy and efficient experience).

The Advantage of OES
One of the key advantages of OES is its simplicity. The entire survey — including all questions and responses — is translated into a single number. This number makes it easy to track trends, compare results over time, and evaluate performance across teams, departments, or locations.
At the same time, OES allows companies to view results from more detailed perspectives:
- Customer and employee satisfaction
- Likelihood to recommend
- Ease of interaction with the company
- Relationship with the brand
Across all these dimensions, Overall Experience Score (OES) provides deep insight into experience trends, the drivers of satisfaction and dissatisfaction, and other critical data that helps companies make better decisions.
Do you need more information about OES?
ISI
InsightSofa Satisfaction Index (ISI)
InsightSofa Satisfaction Index (ISI) is not a metric for collecting feedback — it’s a metric for evaluating feedback. When companies use multiple experience metrics such as NPS, CES, and CSAT, they often need a single, clear indicator that reflects the overall satisfaction of their customers or employees.
ISI combines NPS, CES, and CSAT into one unified score, providing a simple and easy-to-understand indicator of overall customer or employee experience.
The ISI score ranges from 0 to 10 and reflects how your company performs across key experience dimensions — including ease of using your products and services, overall satisfaction, and customer or employee loyalty.
InsightSofa Satisfaction Index (ISI) delivers the most accurate insight when a company measures experience using all major methodologies (NPS, CES, and CSAT). If one of these metrics is missing, the ISI index still works — but the overall perspective becomes slightly less comprehensive.

Calculation
The final InsightSofa Satisfaction Index (ISI) is calculated as the ratio of promoters and positive customers to detractors and negative customers across the different methodologies.
The result is then normalized and converted to a 0–10 scale, providing a clear indicator of the overall level of customer or employee experience.